1992 United States presidential election in Pennsylvania
|
|
| |  |  |  | | Nominee | Bill Clinton | George H. W. Bush | Ross Perot | | Party | Democratic | Republican | Independent | | Home state | Arkansas | Texas | Texas | | Running mate | Al Gore | Dan Quayle | James Stockdale | | Electoral vote | 23 | 0 | 0 | | Popular vote | 2,239,164 | 1,791,841 | 902,667 | | Percentage | 45.15% | 36.12% | 18.20% | |
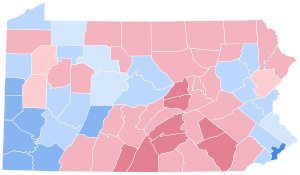 County Results County Results Congressional District Results Congressional District Results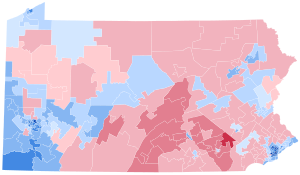 State House District Results State House District Results | Clinton 30-40% 40-50% 50-60% 60-70% 70-80% 80-90% 90-100% | Bush 30-40% 40-50% 50-60% 60-70% | |
President before election
George H. W. Bush
Republican | Elected President
Bill Clinton
Democratic | |
| Elections in Pennsylvania |
|---|
 |
| |
| |
| |
| |
| |
| |
| |
| |
 Government Government |
|
The 1992 United States presidential election in Pennsylvania took place on November 3, 1992, and was part of the 1992 United States presidential election. Voters chose 23 representatives, or electors to the Electoral College, who voted for president and vice president.
Pennsylvania was won by Governor Bill Clinton (D) by a margin of 9.02%.[1] Billionaire businessman Ross Perot (I-TX) finished in third, with 18.20% of Pennsylvania’s popular vote.[1] As of the 2020 presidential election[update], this is the last election in which Clearfield County voted for a Democratic Presidential candidate.[2] This is also the last time that Pennsylvania voted to the left of Connecticut, Delaware, Maine, Michigan, and New Jersey, and to the right of Missouri. This is also the last time a Republican received over 20% of the vote in Philadelphia in a presidential election.
Primaries
Democratic primary
| Candidate | Votes | Percent |
| Bill Clinton | 715,031 | 56.50% |
| Jerry Brown | 325,543 | 25.72% |
| Paul Tsongas | 161,572 | 12.77% |
| Others | 63,349 | 5.01% |
| Totals | 1,265,495 | Turnout: 46.69% |
Republican primary
| Candidate | Votes | Percent |
| George H. W. Bush (incumbent) | 774,865 | 76.81% |
| Patrick Buchanan | 233,912 | 23.19% |
| Totals | 1,008,777 | Turnout: 42.70% |
Results
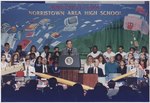 Bush on campaign. Seen here speaking at the Norristown, Pennsylvania High School, September, 1992.
List of United States presidential elections in Pennsylvania
Results by county
| County | Bill Clinton
Democratic | George H.W. Bush
Republican | Ross Perot
Independent | Various candidates
Other parties | Margin | Total votes cast |
| # | % | # | % | # | % | # | % | # | % |
| Adams | 9,576 | 32.46% | 13,552 | 45.94% | 6,313 | 21.40% | 60 | 0.20% | -3,976 | -13.48% | 29,501 |
| Allegheny | 324,004 | 52.75% | 183,035 | 29.80% | 103,470 | 16.85% | 3,678 | 0.60% | 140,969 | 22.95% | 614,187 |
| Armstrong | 12,995 | 45.87% | 9,122 | 32.20% | 6,166 | 21.76% | 50 | 0.18% | 3,873 | 13.67% | 28,333 |
| Beaver | 44,877 | 54.50% | 21,361 | 25.94% | 15,954 | 19.38% | 148 | 0.18% | 23,516 | 28.56% | 82,340 |
| Bedford | 5,840 | 31.04% | 9,216 | 48.98% | 3,731 | 19.83% | 30 | 0.16% | -3,376 | -17.94% | 18,817 |
| Berks | 46,031 | 35.03% | 52,939 | 40.29% | 31,663 | 24.10% | 774 | 0.59% | -6,908 | -5.26% | 131,407 |
| Blair | 14,857 | 33.19% | 21,447 | 47.92% | 8,284 | 18.51% | 170 | 0.38% | -6,590 | -14.73% | 44,758 |
| Bradford | 6,903 | 30.51% | 10,221 | 45.17% | 5,452 | 24.09% | 52 | 0.23% | -3,318 | -14.66% | 22,628 |
| Bucks | 97,902 | 39.40% | 94,584 | 38.06% | 53,931 | 21.70% | 2,090 | 0.84% | 3,318 | 1.34% | 248,507 |
| Butler | 22,303 | 36.48% | 23,656 | 38.70% | 15,013 | 24.56% | 158 | 0.26% | -1,353 | -2.22% | 61,130 |
| Cambria | 34,334 | 51.75% | 20,770 | 31.30% | 11,070 | 16.68% | 175 | 0.26% | 13,564 | 20.45% | 66,349 |
| Cameron | 824 | 30.77% | 1,173 | 43.80% | 676 | 25.24% | 5 | 0.19% | -349 | -13.03% | 2,678 |
| Carbon | 9,072 | 41.89% | 7,243 | 33.44% | 5,222 | 24.11% | 122 | 0.56% | 1,829 | 8.45% | 21,659 |
| Centre | 21,177 | 41.34% | 20,478 | 39.98% | 9,356 | 18.26% | 214 | 0.42% | 699 | 1.36% | 51,225 |
| Chester | 59,643 | 35.25% | 74,002 | 43.73% | 34,536 | 20.41% | 1,027 | 0.61% | -14,359 | -8.48% | 169,208 |
| Clarion | 5,584 | 35.53% | 6,477 | 41.21% | 3,619 | 23.02% | 38 | 0.24% | -893 | -5.68% | 15,718 |
| Clearfield | 12,247 | 39.70% | 11,553 | 37.45% | 6,989 | 22.66% | 58 | 0.19% | 694 | 2.25% | 30,847 |
| Clinton | 5,397 | 42.94% | 4,471 | 35.57% | 2,654 | 21.12% | 47 | 0.37% | 926 | 7.37% | 12,569 |
| Columbia | 8,261 | 34.80% | 9,742 | 41.04% | 5,683 | 23.94% | 53 | 0.22% | -1,481 | -6.24% | 23,739 |
| Crawford | 12,813 | 37.00% | 14,112 | 40.75% | 7,392 | 21.35% | 311 | 0.90% | -1,299 | -3.75% | 34,628 |
| Cumberland | 26,635 | 31.49% | 43,447 | 51.37% | 14,344 | 16.96% | 147 | 0.17% | -16,812 | -19.88% | 84,573 |
| Dauphin | 36,990 | 37.40% | 45,479 | 45.98% | 16,063 | 16.24% | 378 | 0.38% | -8,489 | -8.58% | 98,910 |
| Delaware | 111,210 | 41.80% | 108,587 | 40.81% | 43,728 | 16.43% | 2,549 | 0.96% | 2,623 | 0.99% | 266,074 |
| Elk | 5,016 | 36.26% | 4,908 | 35.48% | 3,885 | 28.09% | 23 | 0.17% | 108 | 0.78% | 13,832 |
| Erie | 56,381 | 47.86% | 39,283 | 33.35% | 21,510 | 18.26% | 630 | 0.53% | 17,098 | 14.51% | 117,804 |
| Fayette | 30,577 | 56.77% | 12,820 | 23.80% | 10,162 | 18.87% | 302 | 0.56% | 17,757 | 32.97% | 53,861 |
| Forest | 890 | 41.51% | 801 | 37.36% | 448 | 20.90% | 5 | 0.23% | 89 | 4.15% | 2,144 |
| Franklin | 13,440 | 30.66% | 23,387 | 53.35% | 6,941 | 15.83% | 66 | 0.15% | -9,947 | -22.69% | 43,834 |
| Fulton | 1,588 | 31.61% | 2,558 | 50.93% | 869 | 17.30% | 8 | 0.16% | -970 | -19.32% | 5,023 |
| Greene | 8,438 | 55.75% | 3,482 | 23.01% | 3,186 | 21.05% | 29 | 0.19% | 4,956 | 32.74% | 15,135 |
| Huntingdon | 5,153 | 32.82% | 7,249 | 46.17% | 3,273 | 20.85% | 25 | 0.16% | -2,096 | -13.35% | 15,700 |
| Indiana | 15,194 | 45.61% | 10,966 | 32.92% | 7,089 | 21.28% | 65 | 0.20% | 4,228 | 12.69% | 33,314 |
| Jefferson | 5,998 | 33.87% | 7,271 | 41.05% | 4,403 | 24.86% | 39 | 0.22% | -1,273 | -7.18% | 17,711 |
| Juniata | 2,601 | 30.89% | 3,980 | 47.27% | 1,819 | 21.60% | 20 | 0.24% | -1,379 | -16.38% | 8,420 |
| Lackawanna | 45,054 | 47.44% | 33,443 | 35.22% | 15,667 | 16.50% | 804 | 0.85% | 11,611 | 12.22% | 94,968 |
| Lancaster | 44,255 | 27.63% | 88,447 | 55.22% | 26,807 | 16.74% | 671 | 0.42% | -44,192 | -27.59% | 160,180 |
| Lawrence | 20,830 | 50.55% | 12,359 | 30.00% | 7,950 | 19.29% | 64 | 0.16% | 8,471 | 20.55% | 41,203 |
| Lebanon | 12,350 | 28.71% | 21,512 | 50.00% | 9,005 | 20.93% | 154 | 0.36% | -9,162 | -21.29% | 43,021 |
| Lehigh | 46,711 | 40.68% | 42,631 | 37.12% | 24,853 | 21.64% | 641 | 0.56% | 4,080 | 3.56% | 114,836 |
| Luzerne | 56,623 | 44.53% | 49,285 | 38.76% | 21,007 | 16.52% | 231 | 0.18% | 7,338 | 5.77% | 127,146 |
| Lycoming | 13,315 | 30.84% | 20,536 | 47.57% | 9,170 | 21.24% | 151 | 0.35% | -7,221 | -16.73% | 43,172 |
| McKean | 5,331 | 32.51% | 6,965 | 42.47% | 4,019 | 24.51% | 85 | 0.52% | -1,634 | -9.96% | 16,400 |
| Mercer | 23,264 | 46.68% | 16,081 | 32.27% | 10,277 | 20.62% | 214 | 0.43% | 7,183 | 14.41% | 49,836 |
| Mifflin | 4,946 | 33.67% | 6,300 | 42.89% | 3,382 | 23.03% | 60 | 0.41% | -1,354 | -9.22% | 14,688 |
| Monroe | 13,468 | 35.91% | 14,557 | 38.82% | 9,257 | 24.69% | 218 | 0.58% | -1,089 | -2.91% | 37,500 |
| Montgomery | 136,572 | 42.87% | 125,704 | 39.46% | 53,738 | 16.87% | 2,562 | 0.80% | 10,868 | 3.41% | 318,576 |
| Montour | 2,150 | 32.35% | 3,096 | 46.58% | 1,373 | 20.66% | 27 | 0.41% | -946 | -14.23% | 6,646 |
| Northampton | 42,203 | 43.27% | 34,429 | 35.30% | 20,234 | 20.75% | 659 | 0.68% | 7,774 | 7.97% | 97,525 |
| Northumberland | 12,814 | 35.80% | 15,057 | 42.07% | 7,782 | 21.74% | 139 | 0.39% | -2,243 | -6.27% | 35,792 |
| Perry | 4,086 | 26.66% | 7,871 | 51.35% | 3,334 | 21.75% | 36 | 0.23% | -3,785 | -24.69% | 15,327 |
| Philadelphia | 434,904 | 68.16% | 133,328 | 20.90% | 65,455 | 10.26% | 4,371 | 0.69% | 301,576 | 47.26% | 638,058 |
| Pike | 4,382 | 32.21% | 6,084 | 44.73% | 3,019 | 22.19% | 118 | 0.87% | -1,702 | -12.52% | 13,603 |
| Potter | 1,892 | 26.86% | 3,452 | 49.01% | 1,687 | 23.95% | 13 | 0.18% | -1,560 | -22.15% | 7,044 |
| Schuylkill | 23,679 | 37.57% | 25,780 | 40.90% | 13,398 | 21.26% | 172 | 0.27% | -2,101 | -3.33% | 63,029 |
| Snyder | 2,952 | 23.44% | 6,934 | 55.05% | 2,686 | 21.32% | 24 | 0.19% | -3,982 | -31.61% | 12,596 |
| Somerset | 12,493 | 38.14% | 13,858 | 42.30% | 6,333 | 19.33% | 75 | 0.23% | -1,365 | -4.16% | 32,759 |
| Sullivan | 1,030 | 33.09% | 1,340 | 43.05% | 731 | 23.48% | 12 | 0.39% | -310 | -9.96% | 3,113 |
| Susquehanna | 5,368 | 32.13% | 7,356 | 44.02% | 3,946 | 23.62% | 39 | 0.23% | -1,988 | -11.89% | 16,709 |
| Tioga | 4,868 | 29.43% | 7,823 | 47.29% | 3,804 | 22.99% | 48 | 0.29% | -2,955 | -17.86% | 16,543 |
| Union | 3,623 | 29.54% | 6,362 | 51.87% | 2,255 | 18.39% | 25 | 0.20% | -2,739 | -22.33% | 12,265 |
| Venango | 8,230 | 38.18% | 8,545 | 39.64% | 4,695 | 21.78% | 84 | 0.39% | -315 | -1.46% | 21,554 |
| Warren | 6,972 | 37.84% | 6,585 | 35.74% | 4,795 | 26.02% | 74 | 0.40% | 387 | 2.10% | 18,426 |
| Washington | 46,143 | 54.70% | 21,977 | 26.05% | 16,083 | 19.06% | 161 | 0.19% | 24,166 | 28.65% | 84,364 |
| Wayne | 4,817 | 28.64% | 8,184 | 48.65% | 3,727 | 22.16% | 94 | 0.56% | -3,367 | -20.01% | 16,822 |
| Westmoreland | 69,817 | 45.20% | 47,315 | 30.63% | 37,036 | 23.98% | 283 | 0.18% | 22,502 | 14.57% | 154,451 |
| Wyoming | 3,158 | 29.11% | 5,143 | 47.40% | 2,525 | 23.27% | 24 | 0.22% | -1,985 | -18.29% | 10,850 |
| York | 46,113 | 34.35% | 60,130 | 44.79% | 27,743 | 20.67% | 259 | 0.19% | -14,017 | -10.44% | 134,245 |
| Totals | 2,239,164 | 45.15% | 1,791,841 | 36.13% | 902,667 | 18.20% | 26,138 | 0.53% | 447,323 | 9.02% | 4,959,810 |
Counties that flipped from Republican to Democratic
References
- ^ a b c David Leip. "1992 Presidential General Election Results – Pennsylvania". Dave Leip’s U.S. Election Atlas. Retrieved March 22, 2018.
- ^ Sullivan, Robert David; ‘How the Red and Blue Map Evolved Over the Past Century’; America Magazine in The National Catholic Review; June 29, 2016
|
|---|
| President | |
|---|
| U.S. Senate | |
|---|
U.S.
House | |
|---|
| Governors | |
|---|
State
legislatures | |
|---|
| Mayors | - Baton Rouge, LA
- Irvine CA
- Orlando, FL
- San Diego, CA
- San Juan, PR
|
|---|
| States | - Alabama
- Alaska
- American Samoa
- Arizona
- Arkansas
- California
- Colorado
- Connecticut
- Delaware
- Florida
- Georgia
- Guam
- Hawaii
- Idaho
- Illinois
- Indiana
- Iowa
- Kansas
- Kentucky
- Louisiana
- Maine
- Maryland
- Massachusetts
- Michigan
- Minnesota
- Mississippi
- Missouri
- Montana
- Nebraska
- Nevada
- New Hampshire
- New Jersey
- New Mexico
- New York
- North Carolina
- North Dakota
- Ohio
- Oklahoma
- Oregon
- Pennsylvania
- Puerto Rico
- Rhode Island
- South Carolina
- South Dakota
- Tennessee
- Texas
- United States Virgin Islands
- Utah
- Vermont
- Virginia
- Washington
- West Virginia
- Wisconsin
- Wyoming
|
|---|

 County Results
 Congressional District Results
 State House District Results


