2002 United States House of Representatives election in the District of Columbia Candidate Eleanor Holmes Norton Patt Kidd Party Democratic Independent Popular vote 119,268 7,733 Percentage 93.01% 6.03%
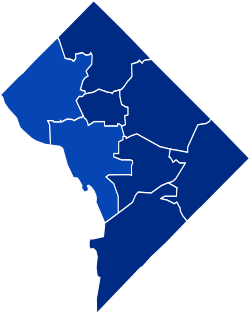
Results by ward:
Norton—>90%
Norton—80–90%
Delegate before election Eleanor Holmes NortonDemocratic
Elected Delegate Eleanor Holmes NortonDemocratic
Elections in the General elections 1974 1976 1978 1980 1982 1984 1986 1988 1990 1992 1994 1996 1998 2000 2002 2004 2006 2008 2010 2012 2014 2016 2018 2020 2022 2024 Mayoral elections Council elections 1974 1976 1977 1978 1980 1982 1984 1986 1988 1990 1992 1993 1994 1996 1997 1998 2000 2002 2004 2006 2008 2010 2012 2013 2014 2016 2018 2020 2022 2024 Attorney General elections
Map of the District of Columbia At-Large district. On November 2, 2002, the District of Columbia held an election for its non-voting House delegate representing the District of Columbia's at-large congressional district . The winner of the race was incumbent Eleanor Holmes Norton (D ).
The delegate is elected for two-year terms.
Candidates Incumbent Del. Eleanor Holmes Norton , a Democrat , sought re-election for a 7th full term to the United States House of Representatives . Norton was opposed in this election by independent challenger Pat Kidd who received 6.03%, resulting in Norton being re-elected with 93.01% of the vote.
Results See also References
U.S. U.S. Governors State Attorneys General State Mayors Anaheim, CA Dallas, TX (special) Irvine, CA Long Beach, CA New Orleans, LA Oakland, CA Providence, RI San Jose, CA Tulsa, OK Washington, DC States Alabama Alaska Arizona Arkansas California Colorado Connecticut Delaware Florida Georgia Hawaii Idaho Illinois Indiana Iowa Kansas Kentucky Louisiana Maine Maryland Massachusetts Michigan Minnesota Mississippi Missouri Montana Nebraska Nevada New Hampshire New Jersey New Mexico New York North Carolina North Dakota Ohio Oklahoma Oregon Pennsylvania Rhode Island South Carolina South Dakota Tennessee Texas Utah Vermont Virginia Washington West Virginia Wisconsin Wyoming